Cache Runtime Auto Scaling
Fluid can disperse data into Kubernetes compute nodes by creating Dataset objects as a medium for data exchange, which can effectively avoid remote writing and reading of data and improve the efficiency of data usage. But the problem here is the resource estimation and provisioning of the data cache. Since accurate data prediction is more difficult to meet before data production and consumption, using on-demand scaling is more user-friendly. The on-demand scaling technology is similar to page cache, which is transparent to the user, but the acceleration it brings is obvious.
Fluid introduces cache elasticity scaling capabilities through a custom HPA mechanism. The condition for elastic scaling is that the elastic expansion of cache space occurs when the amount of existing cache data reaches a certain percentage. For example, if the trigger condition is set to more than 80% and the total cache space is 10G, when the data fills up to 8G of cache space, the scaling will be triggered.
This document will show you this feature.
Prerequisite
-
It is recommended to use Kubernetes 1.18 onwards, because before 1.18, HPA is not able to customize the scaling policy, it is hard-coded. After 1.18, users can customize the scale-out and scale-in policies, such as defining the cooling time after a scaling.
-
Fluid has been installed. If not, please follow the installation guide.
Steps
- Install the jq tool to facilitate parsing json, in this case we are using CentOS, and can install jq via yum
$ yum install -y jq
- Download the community repo if needed
$ git clone https://github.com/fluid-cloudnative/community.git
- Deploy or configure Prometheus
Metrics exposed by the cache engine of AlluxioRuntime are collected here by Prometheus. If there is no Prometheus in your cluster, please follow the Installation guide to set up Prometheus correctly in your production environment.:
If you have Prometheus in your cluster, you can write the following configuration to the Prometheus configuration file:
scrape_configs:
  - job_name: 'alluxio runtime'
    metrics_path: /metrics/prometheus
    kubernetes_sd_configs:
      - role: endpoints
    relabel_configs:
    - source_labels: [__meta_kubernetes_service_label_monitor]
      regex: alluxio_runtime_metrics
      action: keep
    - source_labels: [__meta_kubernetes_endpoint_port_name]
      regex: web
      action: keep
    - source_labels: [__meta_kubernetes_namespace]
      target_label: namespace
      replacement: $1
      action: replace
    - source_labels: [__meta_kubernetes_service_label_release]
      target_label: fluid_runtime
      replacement: $1
      action: replace
    - source_labels: [__meta_kubernetes_endpoint_address_target_name]
      target_label: pod
      replacement: $1
      action: replace
- Verify that the Prometheus installation was successful
$ kubectl get ep -n kube-system  prometheus-svc
NAME             ENDPOINTS        AGE
prometheus-svc   10.76.0.2:9090   6m49s
$ kubectl get svc -n kube-system prometheus-svc
NAME             TYPE       CLUSTER-IP      EXTERNAL-IP   PORT(S)          AGE
prometheus-svc   NodePort   172.16.135.24   <none>        9090:32114/TCP   2m7s
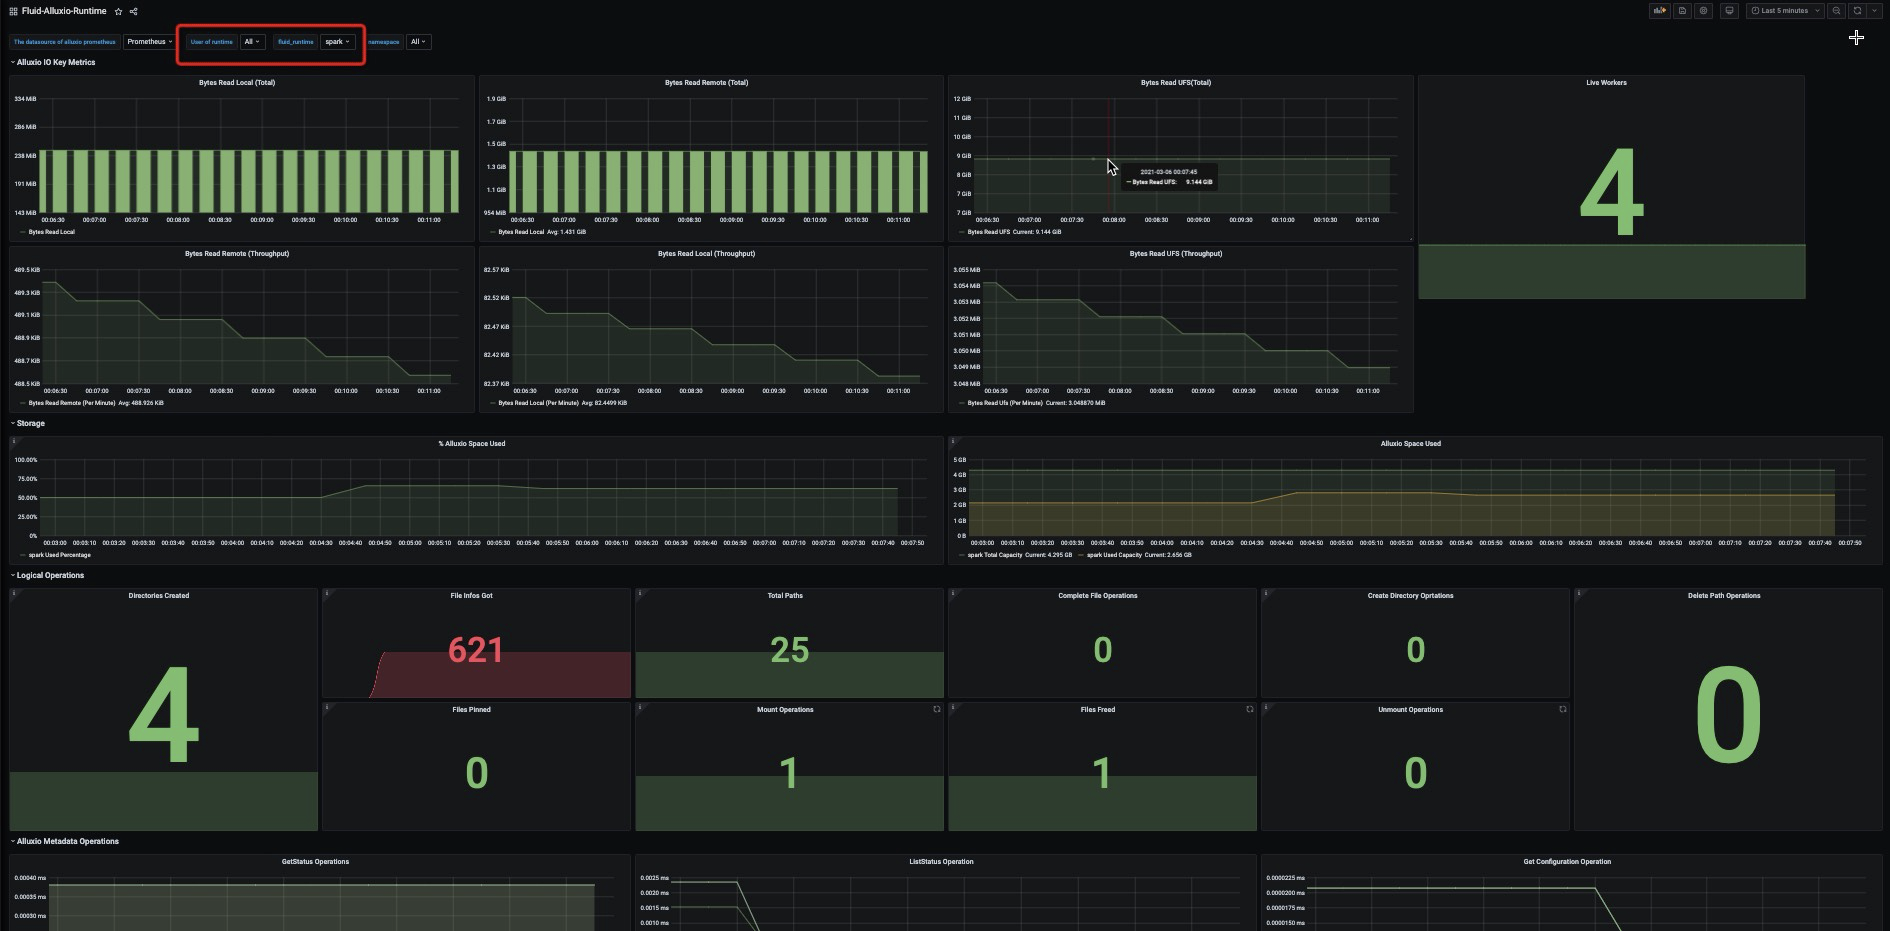
If you want to visualize monitoring metrics, you can install Grafana to verify monitoring data, as described in this documentation.
- Deploy metrics server
Check if the cluster includes a metrics-server, run kubectl top node with correct output for memory and CPU, then the cluster metrics server is correctly configured.
$ kubectl top node
NAME                       CPU(cores)   CPU%   MEMORY(bytes)   MEMORY%
192.168.1.204   93m          2%     1455Mi          10%
192.168.1.205   125m         3%     1925Mi          13%
192.168.1.206   96m          2%     1689Mi          11%
Otherwise, you need to install metrics server from metrics helm chart repo.
- Deploy custom-metrics-api component
In order to scale based on custom metrics, you need to have two components. The first component collects metrics from the application and stores them in the Prometheus time series database. The second component uses the collected metrics to extend the Kubernetes custom metrics API: k8s-prometheus-adapter. The first component is deployed in step 3, and the second component is deployed below.
If custom-metrics-api is already configured, add the dataset-related configuration to the adapter's ConfigMap configuration.
apiVersion: v1
kind: ConfigMap
metadata:
  name: adapter-config
  namespace: monitoring
data:
  config.yaml: |
    rules:
    - seriesQuery: '{__name__=~"Cluster_(CapacityTotal|CapacityUsed)",fluid_runtime!="",instance!="",job="alluxio runtime",namespace!="",pod!=""}'
      seriesFilters:
      - is: ^Cluster_(CapacityTotal|CapacityUsed)$
      resources:
        overrides:
          namespace:
            resource: namespace
          pod:
            resource: pods
          fluid_runtime:
            resource: datasets
      name:
        matches: "^(.*)"
        as: "capacity_used_rate"
      metricsQuery: ceil(Cluster_CapacityUsed{<<.LabelMatchers>>}*100/(Cluster_CapacityTotal{<<.LabelMatchers>>}))
Otherwise, manually execute the following command:
$ kubectl create -f integration/custom-metrics-api
Note: Because custom-metrics-api connects to the Prometheous access address in the cluster, please replace the Prometheous url with the Prometheous address you actually use.
Check custom metrics:
$ kubectl get --raw "/apis/custom.metrics.k8s.io/v1beta1" | jq
{
  "kind": "APIResourceList",
  "apiVersion": "v1",
  "groupVersion": "custom.metrics.k8s.io/v1beta1",
  "resources": [
    {
      "name": "pods/capacity_used_rate",
      "singularName": "",
      "namespaced": true,
      "kind": "MetricValueList",
      "verbs": [
        "get"
      ]
    },
    {
      "name": "datasets.data.fluid.io/capacity_used_rate",
      "singularName": "",
      "namespaced": true,
      "kind": "MetricValueList",
      "verbs": [
        "get"
      ]
    },
    {
      "name": "namespaces/capacity_used_rate",
      "singularName": "",
      "namespaced": false,
      "kind": "MetricValueList",
      "verbs": [
        "get"
      ]
    }
  ]
}
- Submit the Dataset used for testing
$ cat<<EOF >dataset.yaml
apiVersion: data.fluid.io/v1alpha1
kind: Dataset
metadata:
  name: spark
spec:
  mounts:
    - mountPoint: https://mirrors.bit.edu.cn/apache/spark/
      name: spark
---
apiVersion: data.fluid.io/v1alpha1
kind: AlluxioRuntime
metadata:
  name: spark
spec:
  replicas: 1
  tieredstore:
    levels:
      - mediumtype: MEM
        path: /dev/shm
        quota: 1Gi
        high: "0.99"
        low: "0.7"
  properties:
    alluxio.user.streaming.data.timeout: 300sec
EOF
$ kubectl create -f dataset.yaml
dataset.data.fluid.io/spark created
alluxioruntime.data.fluid.io/spark created
- Checking whether the Dataset is available, we can see that the total amount of data in the dataset is 2.71GiB, the number of cache nodes provided by Fluid is 1, and the maximum cache capacity available is 1GiB. At this time, the amount of data cannot meet the demand for full data caching.
$ kubectl get dataset
NAME    UFS TOTAL SIZE   CACHED   CACHE CAPACITY   CACHED PERCENTAGE   PHASE   AGE
spark   2.71GiB          0.00B    1.00GiB          0.0%                Bound   7m38s
- When the Dataset is available, see if the monitoring metrics are already available from the custom-metrics-api
$ kubectl get --raw "/apis/custom.metrics.k8s.io/v1beta1/namespaces/default/datasets.data.fluid.io/*/capacity_used_rate" | jq
{
  "kind": "MetricValueList",
  "apiVersion": "custom.metrics.k8s.io/v1beta1",
  "metadata": {
    "selfLink": "/apis/custom.metrics.k8s.io/v1beta1/namespaces/default/datasets.data.fluid.io/%2A/capacity_used_rate"
  },
  "items": [
    {
      "describedObject": {
        "kind": "Dataset",
        "namespace": "default",
        "name": "spark",
        "apiVersion": "data.fluid.io/v1alpha1"
      },
      "metricName": "capacity_used_rate",
      "timestamp": "2021-04-04T07:24:52Z",
      "value": "0"
    }
  ]
}
- Create HPA
$ cat<<EOF > hpa.yaml
apiVersion: autoscaling/v2beta2
kind: HorizontalPodAutoscaler
metadata:
  name: spark
spec:
  scaleTargetRef:
    apiVersion: data.fluid.io/v1alpha1
    kind: AlluxioRuntime
    name: spark
  minReplicas: 1
  maxReplicas: 4
  metrics:
  - type: Object
    object:
      metric:
        name: capacity_used_rate
      describedObject:
        apiVersion: data.fluid.io/v1alpha1
        kind: Dataset
        name: spark
      target:
        type: Value
        value: "90"
  behavior:
    scaleUp:
      policies:
      - type: Pods
        value: 2
        periodSeconds: 600
    scaleDown:
      selectPolicy: Disabled
EOF
First of all, let's explain the configuration from the sample, there are two main parts here: one is the rule of scaling, and the other is the sensitivity of scaling.
- Rule: The condition to trigger the scaling behavior is that the cached data amount of Dataset object accounts for 90% of the total cache capacity; the scaling object is AlluxioRuntime, the minimum number of replicas is 1 and the maximum number of replicas is 4; and the objects of Dataset and AlluxioRuntime need to be in the same namespace.
- Policy: For K8s version 1.18 or higher, you can set the stability time and the ratio of scaling steps for scale-out and scale-in scenarios respectively. In this example, the scale-out period is 10 minutes (periodSeconds), and 2 replicas are added during the scale-out, which of course cannot exceed the maxReplicas limit; after the scale-out is completed, the cooling time (stabilizationWindowSeconds) is 20 minutes; and the scale-in policy can be chosen to close directly.
- Checking the HPA configuration, the current cache space has a data percentage of 0. This is far below the condition that triggers the scale-out.
$ kubectl get hpa
NAME    REFERENCE              TARGETS   MINPODS   MAXPODS   REPLICAS   AGE
spark   AlluxioRuntime/spark   0/90      1         4         1          33s
$ kubectl describe hpa
Name:                                                    spark
Namespace:                                               default
Labels:                                                  <none>
Annotations:                                             <none>
CreationTimestamp:                                       Wed, 07 Apr 2021 17:36:39 +0800
Reference:                                               AlluxioRuntime/spark
Metrics:                                                 ( current / target )
  "capacity_used_rate" on Dataset/spark (target value):  0 / 90
Min replicas:                                            1
Max replicas:                                            4
Behavior:
  Scale Up:
    Stabilization Window: 0 seconds
    Select Policy: Max
    Policies:
      - Type: Pods  Value: 2  Period: 600 seconds
  Scale Down:
    Select Policy: Disabled
    Policies:
      - Type: Percent  Value: 100  Period: 15 seconds
AlluxioRuntime pods:   1 current / 1 desired
Conditions:
  Type            Status  Reason               Message
  ----            ------  ------               -------
  AbleToScale     True    ScaleDownStabilized  recent recommendations were higher than current one, applying the highest recent recommendation
  ScalingActive   True    ValidMetricFound     the HPA was able to successfully calculate a replica count from Dataset metric capacity_used_rate
  ScalingLimited  False   DesiredWithinRange   the desired count is within the acceptable range
Events:           <none>
- Create DataLoad
$ cat<<EOF > dataload.yaml
apiVersion: data.fluid.io/v1alpha1
kind: DataLoad
metadata:
  name: spark
spec:
  dataset:
    name: spark
    namespace: default
EOF
$ kubectl create -f dataload.yaml
$ kubectl get dataload
NAME    DATASET   PHASE       AGE   DURATION
spark   spark     Executing   15s   Unfinished
- Now you can see that the amount of data cached is close to the caching capacity that Fluid can provide (1GiB) and the scaling condition is triggered
$  kubectl  get dataset
NAME    UFS TOTAL SIZE   CACHED       CACHE CAPACITY   CACHED PERCENTAGE   PHASE   AGE
spark   2.71GiB          1020.92MiB   1.00GiB          36.8%               Bound   5m15s
From the HPA monitor, we can see that the scale-out of Alluxio Runtime has started, and we can see that the scale-out step is 2
$ kubectl get hpa
NAME    REFERENCE              TARGETS   MINPODS   MAXPODS   REPLICAS   AGE
spark   AlluxioRuntime/spark   100/90    1         4         2          4m20s
$ kubectl describe hpa
Name:                                                    spark
Namespace:                                               default
Labels:                                                  <none>
Annotations:                                             <none>
CreationTimestamp:                                       Wed, 07 Apr 2021 17:56:31 +0800
Reference:                                               AlluxioRuntime/spark
Metrics:                                                 ( current / target )
  "capacity_used_rate" on Dataset/spark (target value):  100 / 90
Min replicas:                                            1
Max replicas:                                            4
Behavior:
  Scale Up:
    Stabilization Window: 0 seconds
    Select Policy: Max
    Policies:
      - Type: Pods  Value: 2  Period: 600 seconds
  Scale Down:
    Select Policy: Disabled
    Policies:
      - Type: Percent  Value: 100  Period: 15 seconds
AlluxioRuntime pods:   2 current / 3 desired
Conditions:
  Type            Status  Reason              Message
  ----            ------  ------              -------
  AbleToScale     True    SucceededRescale    the HPA controller was able to update the target scale to 3
  ScalingActive   True    ValidMetricFound    the HPA was able to successfully calculate a replica count from Dataset metric capacity_used_rate
  ScalingLimited  False   DesiredWithinRange  the desired count is within the acceptable range
Events:
  Type     Reason                        Age                    From                       Message
  ----     ------                        ----                   ----                       -------
  Normal   SuccessfulRescale             21s                    horizontal-pod-autoscaler  New size: 2; reason: Dataset metric capacity_used_rate above target
  Normal   SuccessfulRescale             6s                     horizontal-pod-autoscaler  New size: 3; reason: Dataset metric capacity_used_rate above target
- After waiting for a while, the cache space of the dataset is increased from 1GiB to 3GiB, and the data cache is almost completed
$ kubectl  get dataset
NAME    UFS TOTAL SIZE   CACHED    CACHE CAPACITY   CACHED PERCENTAGE   PHASE   AGE
spark   2.71GiB          2.59GiB   3.00GiB          95.6%               Bound   12m
- If we observe the status of the HPA, we can see that the number of replicas of the runtime corresponding to the Dataset is 3, and the ratio of capacity_used_rate to the cache space already used is 85%, which will not trigger the cache scale-out.
$ kubectl get hpa
NAME    REFERENCE              TARGETS   MINPODS   MAXPODS   REPLICAS   AGE
spark   AlluxioRuntime/spark   85/90     1         4         3          11m
- Clean the environment
$ kubectl delete hpa spark
$ kubectl delete dataset spark
Summary
Fluid provides a combination of Prometheous, Kubernetes HPA and Custom Metrics capabilities to trigger automatic elastic scaling based on the proportion of cache space occupied, enabling on-demand use of cache capacity. This helps users to use distributed caching more flexibly to improve data access acceleration, and we will provide the ability to scale up and down at regular intervals to provide stronger determinism for scaling.