Table of Contents
- Introduction
- Why We Built Fluid CLI
- Building the TUI Experience
- Installation
- Usage Guide
- Key Features
- Early Feedback: AI-Assisted Diagnosis in Practice
- Future Improvements
- Conclusion
Introduction
Fluid accelerates data access on Kubernetes by orchestrating distributed cache engines (Alluxio, JuiceFS, JindoFS, and others) behind a unified Dataset abstraction. Operating Fluid in production often means jumping between kubectl commands, controller logs, custom resources, and support threads to understand why a Dataset is stuck in NotBound or why a Runtime pod will not start.
We built Fluid CLI (fluid) to give operators and developers a focused, first-class command-line experience for Fluid workloads. Instead of assembling cluster state by hand, you can:
- Inspect a Dataset and its related Kubernetes resources in one place.
- Diagnose a Dataset by collecting a timestamped support bundle (YAML, events, logs, storage objects).
- Optionally run AI-assisted analysis that correlates symptoms with known Fluid failure patterns.
Fluid CLI is a standalone Go binary. It uses standard Kubernetes client configuration (kubeconfig, --context, -n) and does not require Fluid controllers to be modified.
Why We Built Fluid CLI
Before Fluid CLI, troubleshooting a misbehaving Dataset typically involved several disconnected steps:
- Fetch the Dataset and Runtime CRs with
kubectl get. - Find pods by labels and inspect
describeoutput. - Pull logs from FUSE or worker pods.
- Scan namespace events for warnings.
- Manually copy relevant YAML and logs into a GitHub issue or chat thread.
This workflow is slow, error-prone, and hard to repeat consistently across teams. We wanted a tool that:
- Reduces toil by automating resource discovery and artifact collection.
- Works in both interactive and scripted environments (terminal UI for humans, JSON/table/dir output for CI and support automation).
- Encodes Fluid-specific knowledge (Runtime types, label conventions, Dataset binding rules) so users do not have to memorize them.
- Supports modern troubleshooting workflows, including structured context export and optional LLM analysis for complex incidents.
Fluid CLI is intentionally scoped: it does not install Fluid, deploy applications, or manage cluster lifecycle. It complements kubectl and the Fluid documentation by answering one question well — "What is going on with this Dataset right now?"
Building the TUI Experience
We built four Bubble Tea programs, each with a focused scope:
| Program | Package | Trigger |
|---|---|---|
| Dataset picker | pkg/tui/datasetselect | fluid inspect -n <ns> (no dataset name) |
| Inspect viewer | pkg/tui/inspect | fluid inspect <name> (default -o tui) |
| Diagnose viewer | pkg/tui/diagnose | fluid diagnose <name> (default -o tui) |
| LLM config form | pkg/tui/diagnoseconfig | fluid diagnose config |
Navigation model
Inspect and diagnose viewers share the same interaction pattern:
- Three tabs — switched with
Tab/Shift+Tab(orh/l). - Scrollable tables — arrow keys and
j/kwithin table tabs. - Quit —
q,Esc, orCtrl+C.
Inspect tabs: Overview | Resources | DataOps
Diagnose tabs: Overview | Artifacts | Warnings
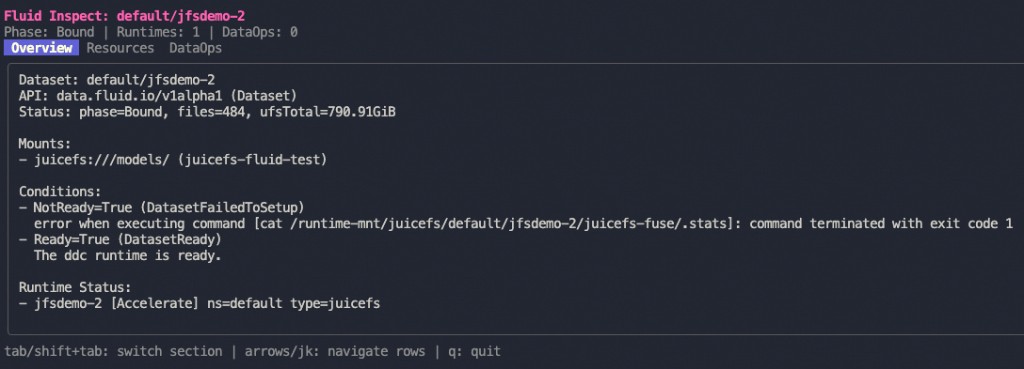
The overview tab shows a text summary (Dataset phase, conditions, mount points, or diagnose summary.txt). Table tabs render collection status and warning events parsed from the manifest.
Inspect — Overview shows Dataset phase, mounts, conditions, and Runtime status in one screen:
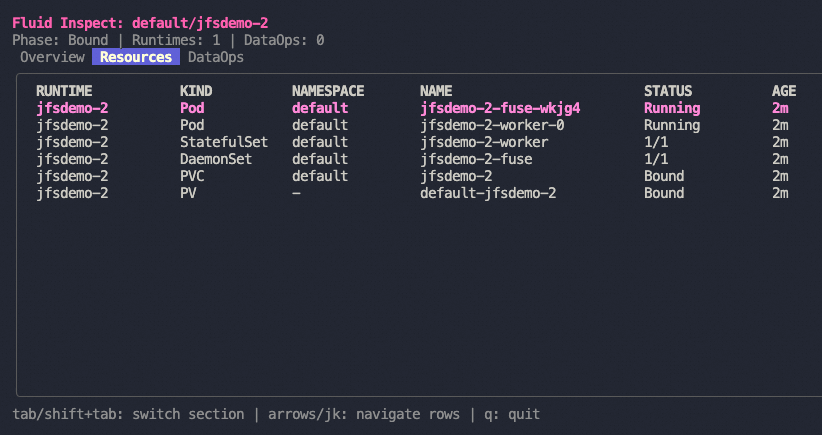
Inspect — Resources lists related Pods, StatefulSets, DaemonSets, PVCs, and PVs:
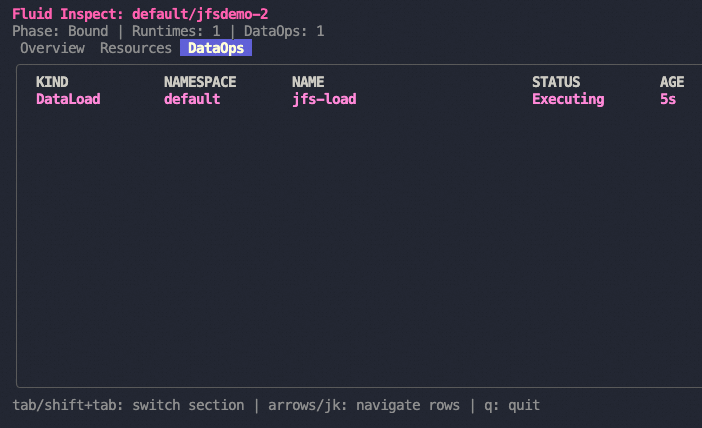
Inspect — DataOps surfaces DataLoad and related operations for the Dataset:
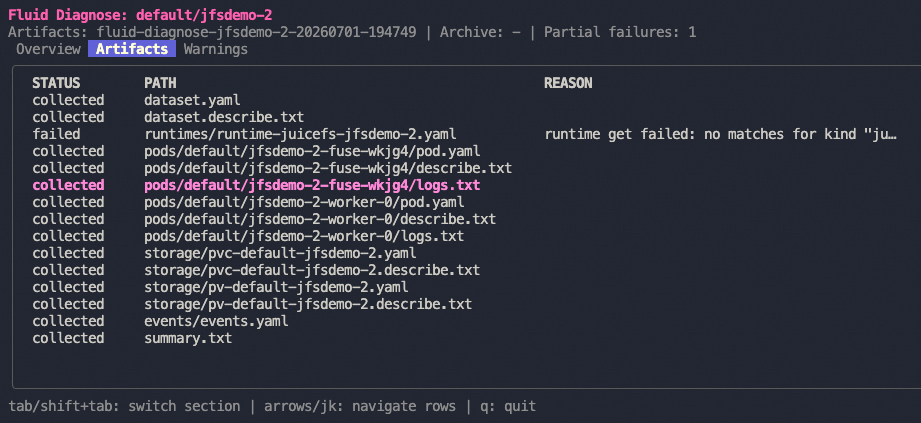
Diagnose — Artifacts browses the collected support bundle, including per-file status and failure reasons:
State management
Each TUI is a self-contained Bubble Tea model. State lives in the model struct (activeTab, table models, terminal dimensions). Window resize messages recalculate table heights so layouts adapt to the terminal size.
The diagnose command collects artifacts to disk before launching the TUI. The viewer reads summary.txt and manifest.json from the output directory — the TUI is a read-only browser over collected data, not a live cluster watch.
Challenges
- Terminal detection: Scripts and CI pipelines must not hang waiting for keyboard input. We gate TUI entry with
EnsureInteractive()and document non-TUI flags (-o dir,-o table,-o json). - Partial failures: Real clusters produce incomplete bundles. The diagnose TUI surfaces partial failure counts and per-artifact status so operators know what is missing before sharing a bundle.
- Consistent styling: Shared helpers in
pkg/tui/common(title, tabs, panel, table factory) keep inspect and diagnose visually aligned without a heavy design system.
Installation
Fluid CLI is installed from source today. There is no Homebrew formula or fluid install subcommand in the repository at the time of writing.
From source (recommended)
git clone https://github.com/fluid-cloudnative/fluid-cli.git
cd fluid-cli
make install-plugin
fluid --help
make install-plugin builds bin/fluid and copies it to a directory on your PATH.
Manual install
make build
cp bin/fluid /usr/local/bin/fluid   # or any directory on your PATH
Prerequisites
- A Kubernetes cluster with Fluid installed (CRDs and controllers running).
- A working kubeconfig (
kubectlshould succeed against the cluster). - For TUI modes: a real terminal (not a pipe-only CI job).
Verify
fluid version
fluid inspect --help
fluid diagnose --help
Usage Guide
fluid inspect — quick health check
Inspect discovers resources associated with a Fluid Dataset: Runtimes, Pods, StatefulSets, DaemonSets, PVCs, PVs, Services, and DataOps.
# Interactive TUI (default)
fluid inspect my-dataset -n default

# Pick a dataset interactively
fluid inspect -n default

# Script-friendly output
fluid inspect my-dataset -n default -o table
fluid inspect my-dataset -n default -o json
fluid inspect my-dataset -n default -o yaml --wide
-o value | Description |
|---|---|
tui (default) | Full-screen terminal UI with Overview, Resources, and DataOps tabs |
table | Columnar text output |
json / yaml | Structured documents for automation |
Use inspect when you want a fast snapshot without collecting pod logs. Use diagnose when you need a support bundle.
fluid diagnose — support bundle collection
Diagnose collects a timestamped directory of artifacts and optionally packages it as tar.gz.
# Collect and browse results in the TUI (default)
fluid diagnose my-dataset -n default

# Write artifacts only (no TUI) — suitable for scripts and CI
fluid diagnose my-dataset -n default -o dir

# Create an archive for attaching to a support ticket
fluid diagnose my-dataset -n default -o dir --archive

# Skip pod logs in large clusters
fluid diagnose my-dataset -n default -o dir --no-logs

# Limit log and event collection to the last hour
fluid diagnose my-dataset -n default -o dir --since 1h

# Include Fluid controller logs from fluid-system
fluid diagnose my-dataset -n default -o dir --include-controller-logs
Output layout
fluid-diagnose-my-dataset-20260314120000/
├── dataset.yaml
├── dataset.describe.txt
├── runtime/
├── pods/
├── events/
├── storage/
├── controllers/          # if --include-controller-logs
├── summary.txt
├── manifest.json
├── context.json          # structured diagnostic context
├── prompt.txt            # LLM-ready prompt text
└── llm-analysis.txt      # when --llm is used
After collection, the CLI prints paths to the artifact directory, context files, archive, and any partial failure count.
fluid diagnose config — LLM settings
Configure an OpenAI-compatible endpoint interactively or via subcommands:
# Interactive form (Bubble Tea)
fluid diagnose config

# Non-interactive
fluid diagnose config set llm-endpoint https://api.openai.com/v1
fluid diagnose config set llm-model gpt-4o-mini
export FLUID_LLM_API_KEY=sk-...

fluid diagnose config view
AI-assisted diagnosis
By default, diagnose writes context.json and prompt.txt without calling an external API. Pass --llm to opt in to automated analysis when an endpoint and API key are configured:
fluid diagnose my-dataset -n default -o dir --llm
The pipeline:
- Build a trimmed DiagnosticContext (Dataset, Runtimes, pods, warning events, summary).
- Run FAQ matching against built-in rules and optional
--faq-filecatalog. - Format a structured prompt with matched FAQs and reference material.
- Call the configured LLM and write
llm-analysis.txt.
FAQ flags:
# Disable FAQ matching
fluid diagnose my-dataset -o dir --faq-skip

# Merge custom rules from the Fluid repo or your own catalog
fluid diagnose my-dataset -o dir \
  --faq-file /path/to/fluid/docs/diagnose-faq.yaml
fluid version
fluid version
Prints version, git commit, and build date embedded at compile time via Makefile LDFLAGS.
Key Features
Interactive terminal workflows
Default output modes open full-screen TUIs for inspect and diagnose. Operators can explore Dataset state and diagnose results without leaving the terminal.
Fluid-aware resource discovery
The inspect package maps Fluid Runtime types to Kubernetes label conventions (JuiceFSRuntime → app=juicefs, etc.) and walks the ownership graph from Dataset to pods, storage, and DataOps.
Timestamped support bundles
Diagnose produces reproducible artifact directories with a machine-readable manifest.json. Partial failures are recorded per file, not silently dropped.
Structured AI context
Rather than sending raw YAML dumps to an LLM, we build a trimmed JSON context and a diagnosis-focused prompt. Built-in FAQ rules (faq-dataset-not-bound, faq-no-runtime-reported, and others) fire deterministically before the model runs, grounding analysis in known Fluid failure modes.
Opt-in LLM analysis
LLM calls are explicit (--llm). Collecting cluster context and prompts does not require network access or API credentials — important for air-gapped clusters and privacy-sensitive environments.
Kubernetes-native authentication
Fluid CLI reuses your existing kubeconfig. No separate login flow or Fluid-specific credentials are required beyond LLM settings for AI analysis.
Early Feedback: AI-Assisted Diagnosis in Practice
Scenario
In a real misconfigured cluster, a Dataset (jfsdemo-2) was stuck in NotBound. The underlying issue involved a Runtime pod that could not start (image not found), but the collected context also exposed a naming mismatch: the Dataset was named jfsdemo-2 while events referenced a JuiceFSRuntime named jfsdemo. In Fluid, a Dataset and its Runtime must share the same name within a namespace to bind.
What the analysis surfaced
The LLM report aligned closely with what an experienced Fluid operator would investigate, organized into clear sections:
Unhealthy signals
- Dataset stuck in
NotBound. - Zero associated runtimes discovered in the diagnostic context.
- Warning events referencing JuiceFS DDC engine setup failure (
.statsfile read from FUSE mount path failed).
Evidence correlation and matched FAQs
faq-dataset-not-bound— applied; consistent with a missing or incorrect Runtime reference.faq-no-runtime-reported— applied; zero runtimes reported, matching the discovery gap from the naming mismatch.
Ranked hypotheses
- Dataset / Runtime name mismatch (high confidence) —
jfsdemo-2vsjfsdemoprevents binding. - JuiceFS FUSE mount / engine initialization failure (high confidence) — independent mount or credentials issue that would block readiness even after renaming.
Uncertainties and follow-ups
- Confirm whether a
JuiceFSRuntime/jfsdemo-2exists or onlyjfsdemois present. - Inspect FUSE pod and controller logs for authentication or backend connectivity errors.
- Review
JuiceFSRuntime/jfsdemostatus conditions for the exact failing setup stage.
This exercise validated several design choices:
- FAQ matching before the LLM gives the model structured anchors instead of free-form guessing.
- OpenAI-compatible endpoints let teams use their preferred provider without vendor-specific client code in the CLI.
- The support bundle + context pipeline produces enough signal for useful analysis even when multiple root causes overlap (naming mismatch and image pull failure).
Future Improvements
These are directions we are considering; they are not committed roadmap items:
- Packaged releases — pre-built binaries and optionally a Homebrew formula to remove the
make install-pluginrequirement. - Expanded FAQ catalog — ship and version FAQ rules alongside Fluid releases; improve Markdown FAQ ingestion from the main Fluid documentation.
- Richer inspect output — deeper Runtime condition details and pod log snippets in the inspect TUI without full diagnose collection.
- CI-friendly diagnose profiles — preset flag combinations (
--no-logs,--since,--archive) for support bots and GitHub Actions workflows. - Additional output formats — e.g. SARIF or structured issue templates generated from
context.json.
Conclusion
Fluid CLI is our answer to a practical problem: Fluid Dataset troubleshooting is multi-resource, log-heavy, and domain-specific, and generic Kubernetes tools alone do not capture the full picture.
We built it with:
- Cobra for a familiar, grouped command structure aligned with the Kubernetes ecosystem.
- Bubble Tea, Bubbles, and Lip Gloss for interactive inspect and diagnose experiences in the terminal.
- controller-runtime and client-go for typed Fluid CRD access and core API operations.
- A diagnose pipeline that produces reproducible support bundles, structured context, FAQ-grounded prompts, and optional LLM analysis.
For operators, that means faster incident response and cleaner support handoffs. For developers contributing to Fluid, it means encoding operational knowledge into a tool that gets better as the FAQ catalog and inspect logic grow.
If you run Fluid on Kubernetes, try:
fluid inspect <your-dataset> -n <namespace>
fluid diagnose <your-dataset> -n <namespace> -o dir --archive
We welcome issues and contributions in the fluid-cli repository.
License: Apache 2.0. Fluid CLI is part of the Fluid Cloud Native project.